 Jacob Tomlinson
Originally published on the RAPIDS AI blog on August 13th, 2019.
Background
In my first week working at NVIDIA, I have been spending some time with my previous colleagues at the Met Office to explore how the two organizations can collaborate.
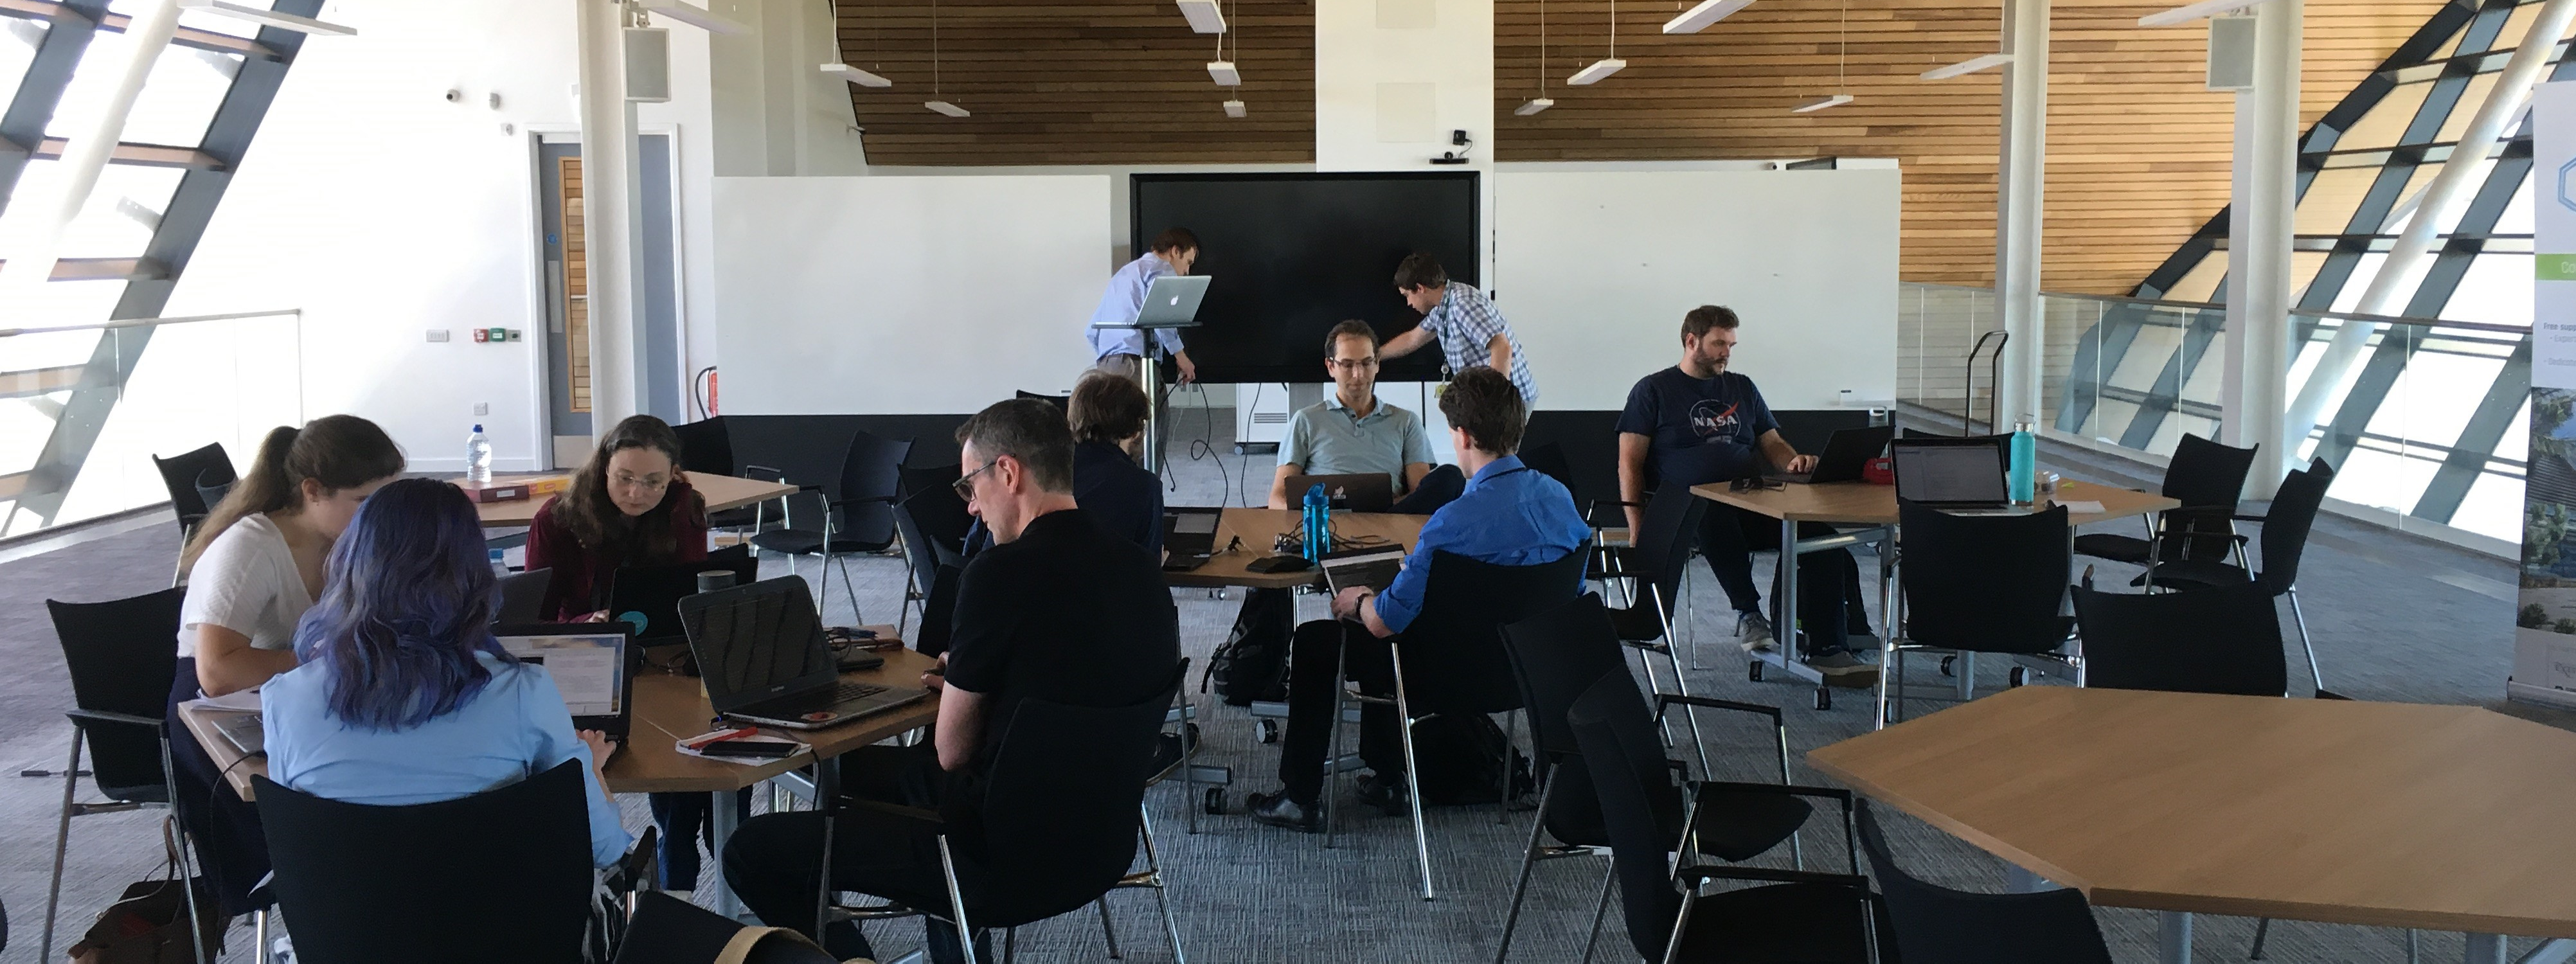
We decided to run a hackathon to explore how GPUs could be used to accelerate existing tools and workflows within the Met Office. The attendees were 10-15 people who were seasoned Python developers but had little experience with GPUs. There was some awareness and curiosity about CUDA and GPU acceleration but little hands on experience.
To begin trying things out we needed a collaborative environment with access to GPUs. Our group was familiar with Jupyter Notebooks and we felt that asking people to SSH into a server would add unnecessary complication. There is a project called the Littlest JupyterHub (tljh) which not only provides a straight forward way to install and manage Jupyter Hub on a single server but also has great documentation. However, as we wanted to add GPU support, we had to deviate from the docs a little. This post encapsulates the additional steps we took.
Setup
The Met Office folks kindly provided access to an AWS account so that we could build our own server.
Infrastructure
At this time tljh only supports ubuntu linux so first we will need to build a ubuntu server with GPUs available. As we had AWS access we will go through the excellent instructions from the tljh docs to set up on AWS with the following adjustments.
- Steps 1–5 can be found in tljh docs here
- At step 6 we selected a p3.8xlarge instance as it comes with four NVIDIA Tesla V100 GPUs.
- At step 7 we skipped entering the user data (bootstrapping script) as we wanted to run this ourselves manually later.
- At step 8 we selected 100GB to give ourselves reasonable space for data.
- Stop after step 16. As we skipped step 7, steps 17–19 do not apply and we need to do some manual configuration before continuing.
Drivers
Next you need to ssh to the box with the ssh key you selected during setup. In order to make use of GPU enabled libraries we needed to install the NVIDIA CUDA drivers.
- Visit https://www.nvidia.co.uk/Download/index.aspx
- Select the appropriate GPU for the instance (in this case Tesla V100)
- Select Linux 64-bit Ubuntu 18.04
- WARNING: Do not select the generic linux 64-bit driver as it will not work on ubuntu
- Copy the download link and run
wgeton the EC2 instance to download the.debfile. - Install your
.debfile on the server (in our case we randpkg -i nvidia-diag-driver-local-repo-ubuntu1804-418.67_1.0-1_amd64.debbut your driver file name may differ)
- This will have installed a new repository but not the actual drivers so let’s also do that.
apt-get updateapt-get install cuda-drivers- We now need to
rebootfor the drivers to be loaded into the kernel
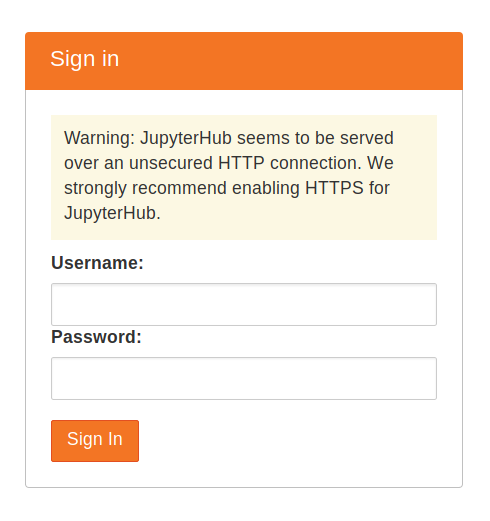
JupyterHub
Now that we have drivers in place and have rebooted we can install the Littlest JupyterHub as instructed in the documentation. In step 7 we skipped entering the installation command in the user data field, so let’s run that manually now.
$ curl https://raw.githubusercontent.com/jupyterhub/the-littlest-jupyterhub/master/bootstrap/bootstrap.py | sudo python3 - --admin <admin-user-name>
Select an admin username that you will remember as you will need that the first time you log in to JupyterHub.
We should now be able to return to the tljh documentation and continue from step 20 by visiting the server’s IP address in the browser.
Once you finish this I also recommend upgrading conda and Jupyter Lab to the latest version by running the following from within Jupyter Lab.
$ sudo -E conda upgrade conda -y
$ sudo -E pip install -U jupyterlab
RAPIDS
Now that we have a working environment we can get on with the interesting bit of installing the packages from RAPIDS. There is a useful utility on the RAPIDS website for constructing your installation command.
You should select:
- Conda
- RAPIDS Stable
- All packages
- Python 3.7
- CUDA 10.0
Then copy the command, prefix it with sudo -E, add cupy to the end and run it in Jupyter Lab. For me this command looked like this.
$ sudo -E conda install -c nvidia -c rapidsai -c numba -c conda-forge -c pytorch -c defaults \
cudf cuml cugraph python=3.7 cudatoolkit cupy
Testing
To make sure things work we can create a couple of notebooks and use some of these libraries.
cudf
Let’s start with cuDF. To check this we can visit the documentation and copy the getting started example.
import cudf, io, requests
from io import StringIO

url="https://github.com/plotly/datasets/raw/master/tips.csv"
content = requests.get(url).content.decode('utf-8')

tips_df = cudf.read_csv(StringIO(content))
tips_df['tip_percentage'] = tips_df['tip'] / tips_df['total_bill'] * 100

# display average tip by dining party size
print(tips_df.groupby('size').tip_percentage.mean())
If everything works ok you should see the following output.
size
1    21.729201548727808
2    16.571919173482897
3    15.215685473711837
4    14.594900639351332
5    14.149548965142023
6    15.622920072028379
Name: tip_percentage, dtype: float64
CuPy
We can also test CuPy out by creating an array and playing around with it.
import cupy as cp
x = cp.arange(6).reshape(2, 3).astype('f')
print(x.sum(axis=1))
This should show
array([ 3., 12.], dtype=float32)
Uses
Now we have a great place to experiment with GPU accelerated Python libraries. At the Met Office hackathon, people were experimenting with things like replacing numpy with cupy in existing libraries.
Future Enhancements
Having this machine was great for an event like a hackathon. It was quick to build, simple to administer and provided a familiar interface for users. We shut it down each night to save money and then blew the whole thing away when the event was done (once everyone had downloaded their notebooks of course). Next time I build one of these there are a few additional features I would like to explore.
Rotating GPUs
We had four GPUs shared between 10-15 people. As everyone was a beginner and wouldn’t actually be doing that much intensive calculation with them this was fine. However, by default their python environments would be using GPU 0 for single GPU tasks which means we wouldn’t be making good use of the other three GPUs without additional configuration.
It is possible to change your GPU order with the environment variable CUDA_VISIBLE_DEVICES. In future deployments we could get JupyterHub to set this variable for each user and randomize the order.
GPU Dashboard
To give new users a better understanding of what is going on it would be great to give them a dashboard showing what the GPUs are doing. There is currently a PR for a Jupyter Lab extension which would show useful metrics right within Jupyter Lab. Once this is available I wouldn’t hesitate to install it too.